Coralogix Telemetry Lake Benchmarks.

Next refresh in –:–– Take the tour

Global Stats - Past 7 days

All data in every Coralogix environment, over the last 7 days.

The total Coralogix estate over the past 7 days: scale, complexity and query volume.

A large scale single account benchmark

A scaled account ingesting 40 TB a day, 1.2 PB queryable and 483 million timeseries of metrics.

Queries, last 7 days
Logs, Spans, SIEM, RUM, AI sessions
Queries156,744
p50 latency1.0 s
p90 latency5.4 s
p95 latency12 s
Custom metrics, Infra, APM metrics
Queries373M
p50 latency13 ms
p90 latency196 ms
p95 latency438 ms

A medium scale single account benchmark

A mid size account ingesting 300 GB a day, 9 TB queryable and 847,667 timeseries of metrics.

Queries, last 7 days
Logs, Spans, SIEM, RUM, AI sessions
Queries60,714
p50 latency341 ms
p90 latency717 ms
p95 latency871 ms
Custom metrics, Infra, APM metrics
Queries7M
p50 latency15 ms
p90 latency206 ms
p95 latency269 ms

DataPrime latency over time

p50p90p95

Latency by data type

p50p90p95

Median latency by DataPrime query type and volume

Events estimated at 1 KB each.

Take the tour

Learn about an architecture that handles billions of daily queries and hundreds of petabytes of data, supporting hundreds of industry leading products and driving unprecedented customer savings.
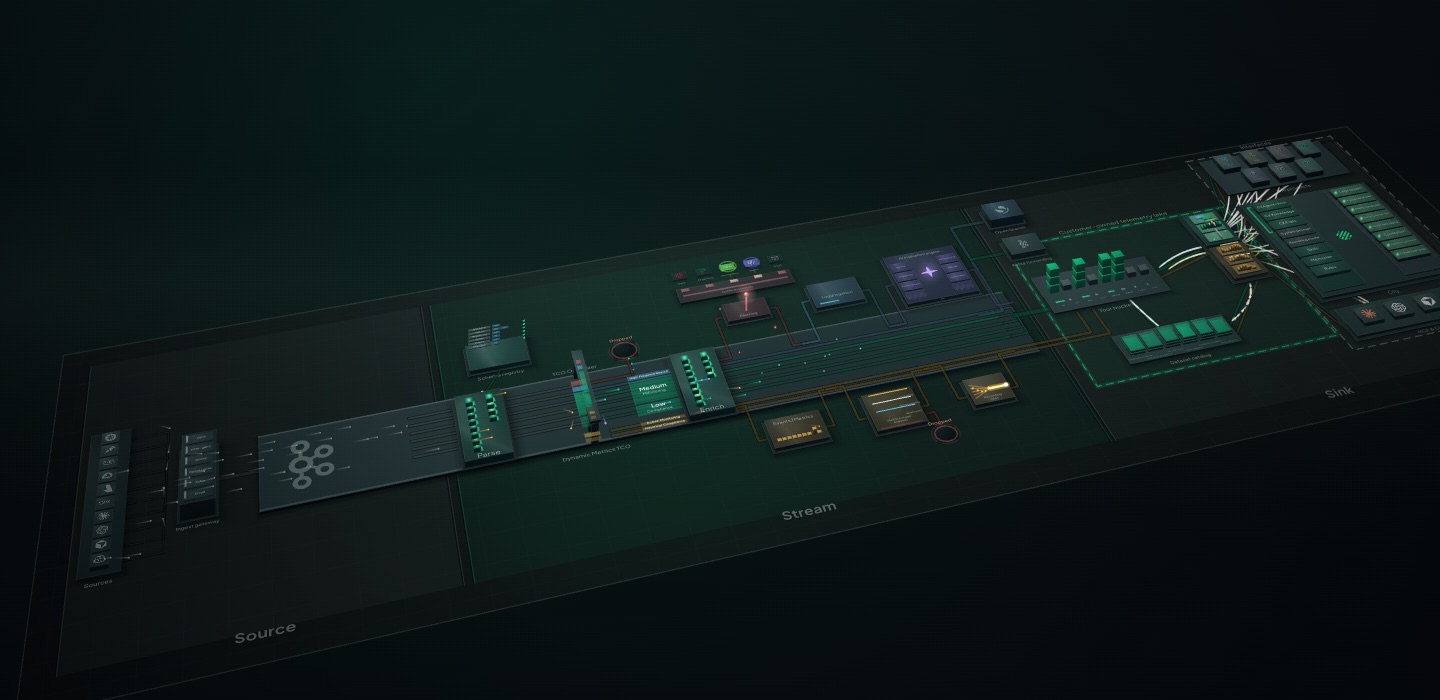
The Streama model: sources, the Kafka highway with its toll gate and services, and the customer-owned telemetry lake with its engines and interfaces Take the tour

How does all this work?

What sets Coralogix apart is its data layer: a single Telemetry Lake. You ingest unsampled, full-fidelity data, keep it in your own cloud object storage, and query it whenever you like, whatever the signal, use case or reader. Here’s how it works.

Not a static index. An evolving schema

Most platforms fix a field’s type the first time they see it. When the type changes, as it does whenever a team ships new code, you get a mapping exception, and the event is rejected or the field goes unindexed.

DataPrime builds an evolving schema instead. It tracks every field’s type over time and supports multi-type fields, so a field can be a number one day, a string the next and an object after that. Every event is kept, and every version of the field stays queryable.

Go indexless with Coralogix and you’re done with mapping exceptions and schema management for good.

Static index Evolving schema Monday {"user_id": 42} user_id number user_id number Tuesday {"user_id": "u-42"} Mapping exception user_id number string Wednesday {"user_id": {"id": 42}} Mapping exception user_id number string object Static index user_id Mon 42 number Tue "u-42" Mapping exception Wed {"id": 42} Mapping exception Evolving schema user_id Mon 42 number Tue "u-42" number string Wed {"id": 42} number string object

Built on open standards

Customers want more than open source. They want portable standards that add value to their business without tying it to a vendor.

We contribute to OpenTelemetry, from its Kubernetes Operator and Helm charts to the OpenTelemetry eBPF Instrumentation (OBI), and we’re contributing more all the time.

In-stream means realtime

Observability use cases are measured in seconds, so we started by rethinking ingestion. Streama, our Kafka-based processing engine, transforms, enriches, parses, alerts on and generates metrics from data as it streams, without waiting on indexing or storage. Alerts fire faster, transformations happen instantly, and the platform costs less to run, a saving we pass on to customers.

Because analysis happens before storage, Streama can make routing decisions for you: generate a metric from a log and drop the original, and you keep the signal without paying to store the noise. That’s the power of separating storage from analysis.

Source, stream, sink

Source

Data is ingested from any external source using Kafka Connect, which produces events and state to Kafka topics and KTables.

kafka

Stream

Events flow to Kafka for stream analysis and are automatically parsed, enriched, and clustered using machine learning algorithms.

kafka

Sink

Data and insights go to any external destination once they’ve passed through the stream analysis engine.

In-stream means CPU bound

Stream processing is CPU-bound work, so Coralogix scales ingestion and processing independently of storage and indexing. When traffic spikes, Streama adds capacity in seconds and releases it when traffic falls, so we keep pace with customer demand without waiting on storage.

Incoming events Stream processors Incoming events

Alerts at extreme scale and performance

Alerting runs in the stream, with no dependency on storage. Alerts analyse data as it moves through the stream, meaning instant alert triggers and no indexing lag. This architecture also means that in the event of query or ingest lag, alerts operate just fine.

This drives millions of alerts, with no impact on performance or cost.

Incoming events Alert rules Storage Incoming events Alert rules Storage

Your storage is not an archive

Coralogix writes every event to your cloud object storage by default, and DataPrime queries it there directly. For the small subset of events that need millisecond ingestion and the fastest queries, you can also write to OpenSearch.

Data lands in wide Parquet, a columnar format we’ve tuned for observability. You route data into your own datasets and choose the bucket each one writes to.

OpenSearch Streama Your cloud object storage Amazon S3 Azure Blob Cloud Storage IBM COS timestamp 12:04:01.113 12:04:01.118 12:04:01.121 12:04:01.140 12:04:02.007 12:04:02.012 12:04:02.031 12:04:02.044 12:04:03.090 12:04:03.102 12:04:03.117 12:04:03.125 severity INFO INFO ERROR INFO WARN INFO INFO ERROR INFO DEBUG INFO WARN service checkout cart payments checkout auth cart search payments checkout auth search cart trace_id 4bf92f35 a3ce929d 0af76519 4bf92f35 b7ad6b71 a3ce929d e457b5a2 0af76519 9c1e44d0 b7ad6b71 e457b5a2 5d2f1a07 duration_ms 42 7 1318 38 211 9 64 1402 45 3 58 187 http.status 200 200 500 200 429 200 200 503 200 204 200 404 region eu-west-1 eu-west-1 us-east-1 eu-west-1 ap-south-1 eu-west-1 us-east-1 us-east-1 eu-west-1 ap-south-1 us-east-1 eu-west-1 k8s.pod checkout-7f9 cart-2c1 pay-9b4 checkout-7f9 auth-41d cart-2c1 search-0e7 pay-9b4 checkout-a12 auth-41d search-0e7 cart-6f3 user.tier gold free gold pro free free pro gold gold free pro free host.arch arm64 arm64 amd64 arm64 amd64 arm64 arm64 amd64 arm64 amd64 arm64 arm64 db.system postgres redis postgres postgres redis redis elastic postgres postgres redis elastic redis feature.flag new-cart new-cart beta new-cart beta OpenSearch Streama Your cloud object storage Amazon S3 Azure Blob Cloud Storage IBM COS severity INFO INFO ERROR INFO service checkout cart payments checkout duration_ms 42 7 1318 38

Your storage means your data

Your data rests in your cloud object storage, the most scalable place to keep telemetry, and nowhere else. You pay Coralogix for processing, not retention.

It fits into your wider data strategy, with no vendor lock-in and no punitive migration charges.

CoralogixWhat you pay for: processing
Your bucketData at rest, in your cloud account, on your terms
Your data lakeYour warehouseYour analytics tools

Open, portable format

Logs, spans, SIEM events, RUM sessions and AI sessions are stored as Parquet, and metrics in an open, machine-readable format, in your own object storage. Any engine that reads Parquet can read your telemetry: Apache Spark, Trino, Athena, DuckDB, your warehouse, a notebook.

So Coralogix storage is not a dead end. It is a nexus: one lake that the rest of your data architecture consumes from directly, with no export step and no second copy.

Streama Your cloud object storage Parquet Open metrics Coralogix Apache Spark Trino and Athena DuckDB Your warehouse Notebooks and ML Streama Your cloud object storage Parquet Open metrics Coralogix Apache Spark Trino and Athena DuckDB Your warehouse Notebooks and ML

Data is never at rest

Coralogix uses dynamic materialization: the fields you query most stay materialized for speed, and the ones you rarely touch move into a lower-footprint encoding. It weighs each field’s cardinality and how often it’s read, so your storage footprint is never larger than your queries need.

It tracks thousands of fields at once, so however broad your access patterns, the data you need is in the right encoding. Fields that aren’t materialized are still fully queryable: DataPrime decodes them on the fly.

Materialized Encoded trace_id k8s.pod severity user.agent user.agent severity service feature.flag duration_ms build.sha build.sha duration_ms http.route client.ip Materialized Encoded trace_id k8s.pod severity user.agent user.agent severity service feature.flag duration_ms build.sha build.sha duration_ms

DataPrime means unrestricted access

DataPrime is one language for all your telemetry, with schema-on-read querying, complex joins, window functions, unions and hundreds of native functions and commands. The engine plans every query and runs it in parallel, so even complex analyses scan terabytes in seconds.

And it never needs rehydration: any part of your data, however old, is queryable at any time.

source logs | filter $m.severity == ERROR | join (source spans | groupby $d.traceID aggregate max($d.duration) as slowest) on left=>$d.trace_id == right=>$d.traceID into $d.trace | groupby $l.subsystemname aggregate count() as errors, percentile(0.95, $d.trace.slowest) as p95_span | orderby errors desc logs/0001.parquet severity service trace INFO payments 5d2f DEBUG payments 4bf9 INFO auth b7ad INFO checkout 1f3b INFO cart 77e0 DEBUG checkout e457 ERROR search 0af7 logs/0002.parquet severity service trace DEBUG checkout b7ad DEBUG auth c81a INFO cart 1f3b INFO auth 1f3b INFO payments c81a DEBUG search 9c1e INFO auth a3ce logs/0003.parquet severity service trace ERROR checkout e457 INFO auth 5d2f INFO payments 1f3b ERROR cart 0af7 WARN cart 5d2f INFO search 5d2f INFO cart a3ce spans/0001.parquet trace service ms 1f3b auth 12 1f3b payments 1318 4bf9 search 211 5d2f search 118 b7ad checkout 7 4bf9 search 7 1f3b payments 3 spans/0002.parquet trace service ms e457 ledger 64 c81a auth 211 e457 payments 211 9c1e search 12 a3ce payments 42 77e0 cart 540 b7ad cart 118 spans/0003.parquet trace service ms 4bf9 payments 3 9c1e search 211 a3ce payments 38 1f3b auth 1318 a3ce ledger 7 0af7 auth 118 5d2f ledger 211 source logs | filter $m.severity == ERROR | join (source spans) on left=>$d.trace_id == right=>$d.traceID into $d.trace | groupby $l.subsystemname aggregate count() as errors logs/0001.parquet severity trace INFO c81a ERROR c81a INFO b7ad WARN 1f3b INFO e457 DEBUG 4bf9 spans/0001.parquet trace ms 4bf9 118 e457 38 9c1e 7 c81a 38 1f3b 64 a3ce 211